go to top
Obsidian Business Service Intelligence

Portfolio

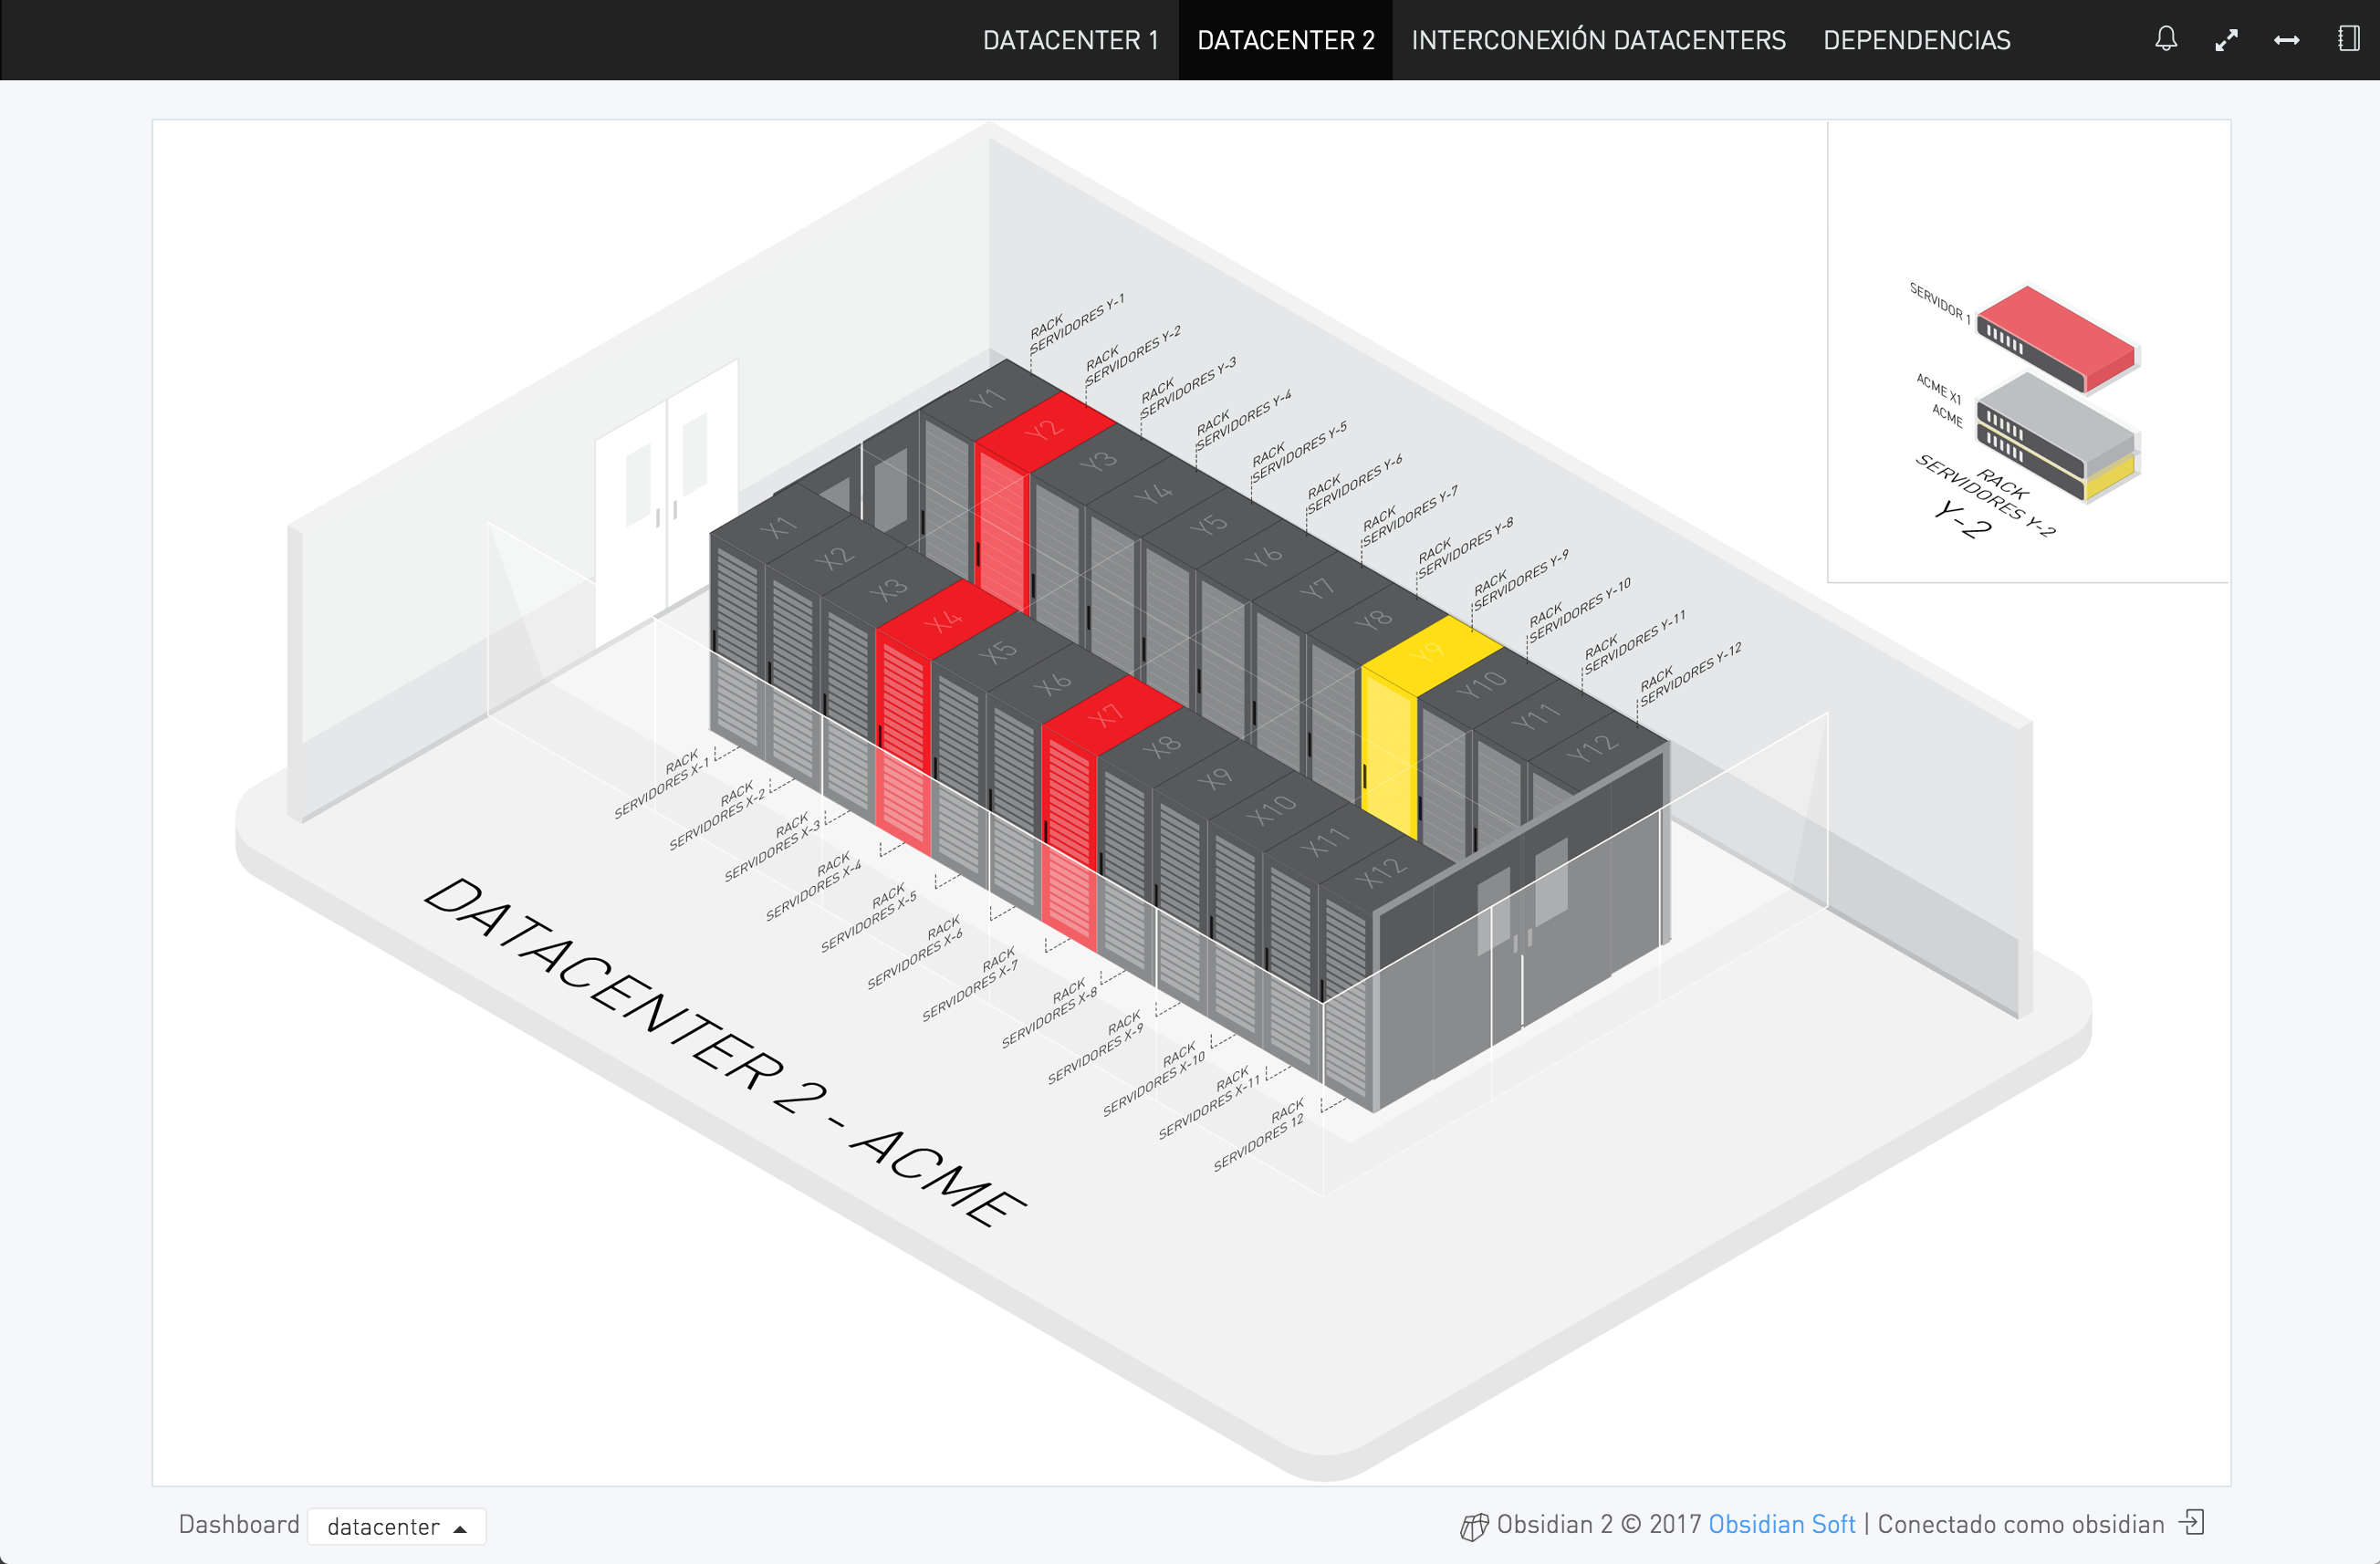
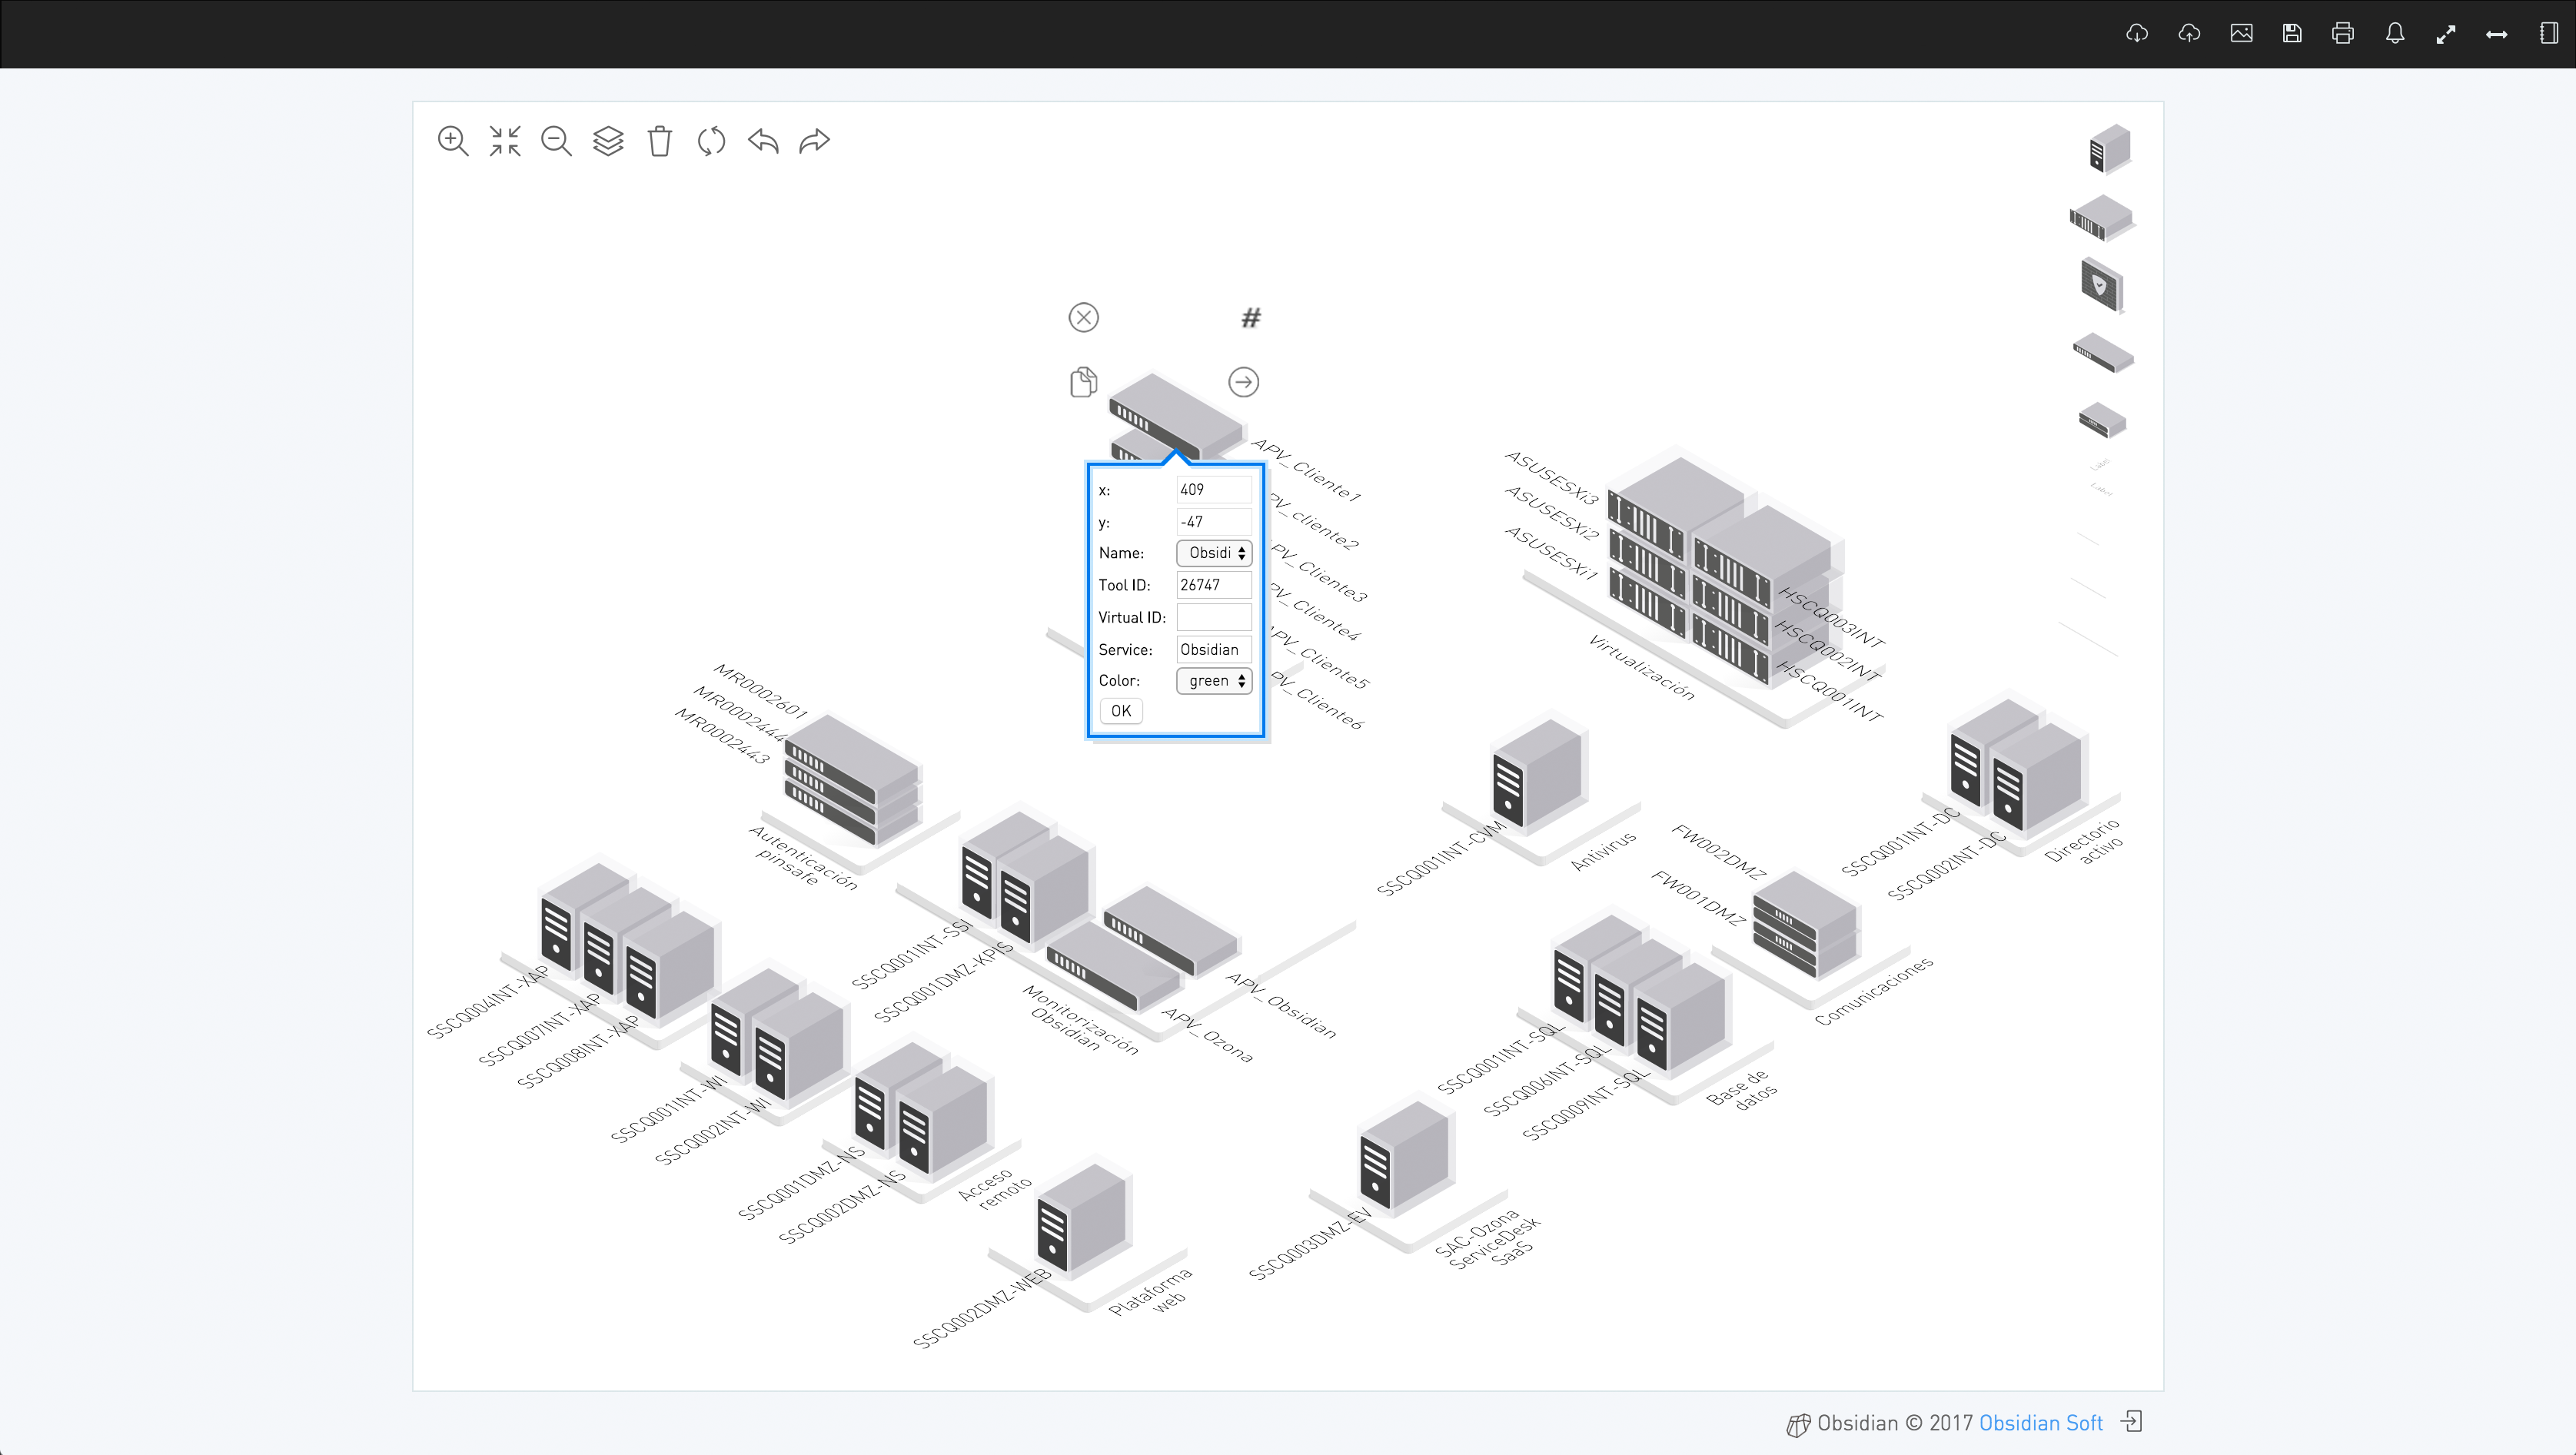
Infrastructure maps created using Obsidian’s online editor

In addition to an API for integration of any type of SVG diagrams, Obsidian also offers an online editor for isometric map creation. This example shows a real design of an infrastructure map created using Obsidian's online generator which has complete service modelling integration and immediate...

Datacenter Map

Using Obsidian's SVG image integration API for isometric representation of server racks within a data center cage. Each rack displays the colour corresponding to the state of the worst server or infrastructure component it contains. Server details are displayed to the right by hovering the mouse over...

X