go to top
Obsidian Business Service Intelligence

Obsidian service provision report generated by Tableau

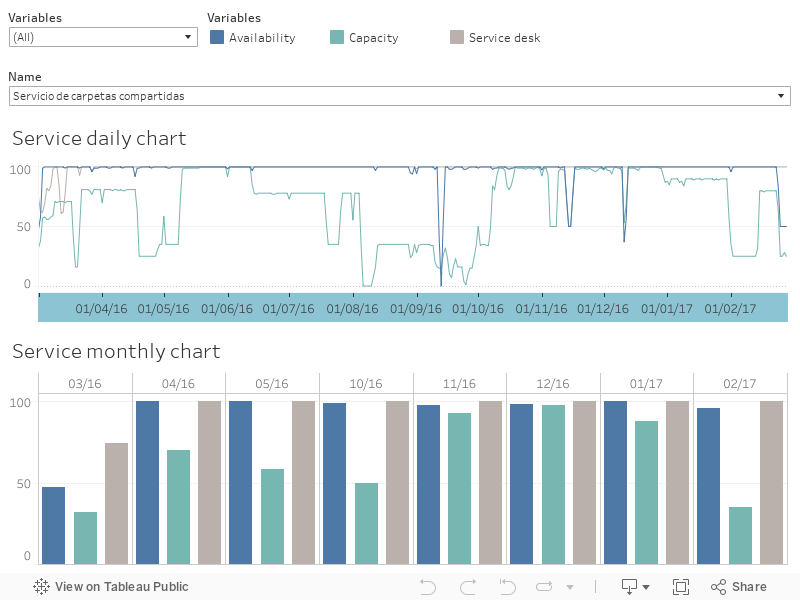
Example of Obsidian’s integration with Tableau for exporting monthly reports on service provision.

The exported data shows daily and monthly data on availability, capacity, service desk and service level for each service. It includes statistical data shown as volume, average, minimum, first quartile, median, third quartile, maximum and standard deviation.

It also includes automatic natural language processing of the monthly results generated by Obsidian’s data2text model.

X
Obsidian
Privacy Overview

This website uses cookies so that we can provide you with the best user experience possible. Cookie information is stored in your browser and performs functions such as recognising you when you return to our website and helping our team to understand which sections of the website you find most interesting and useful.

Please check our cookie policy for details.