

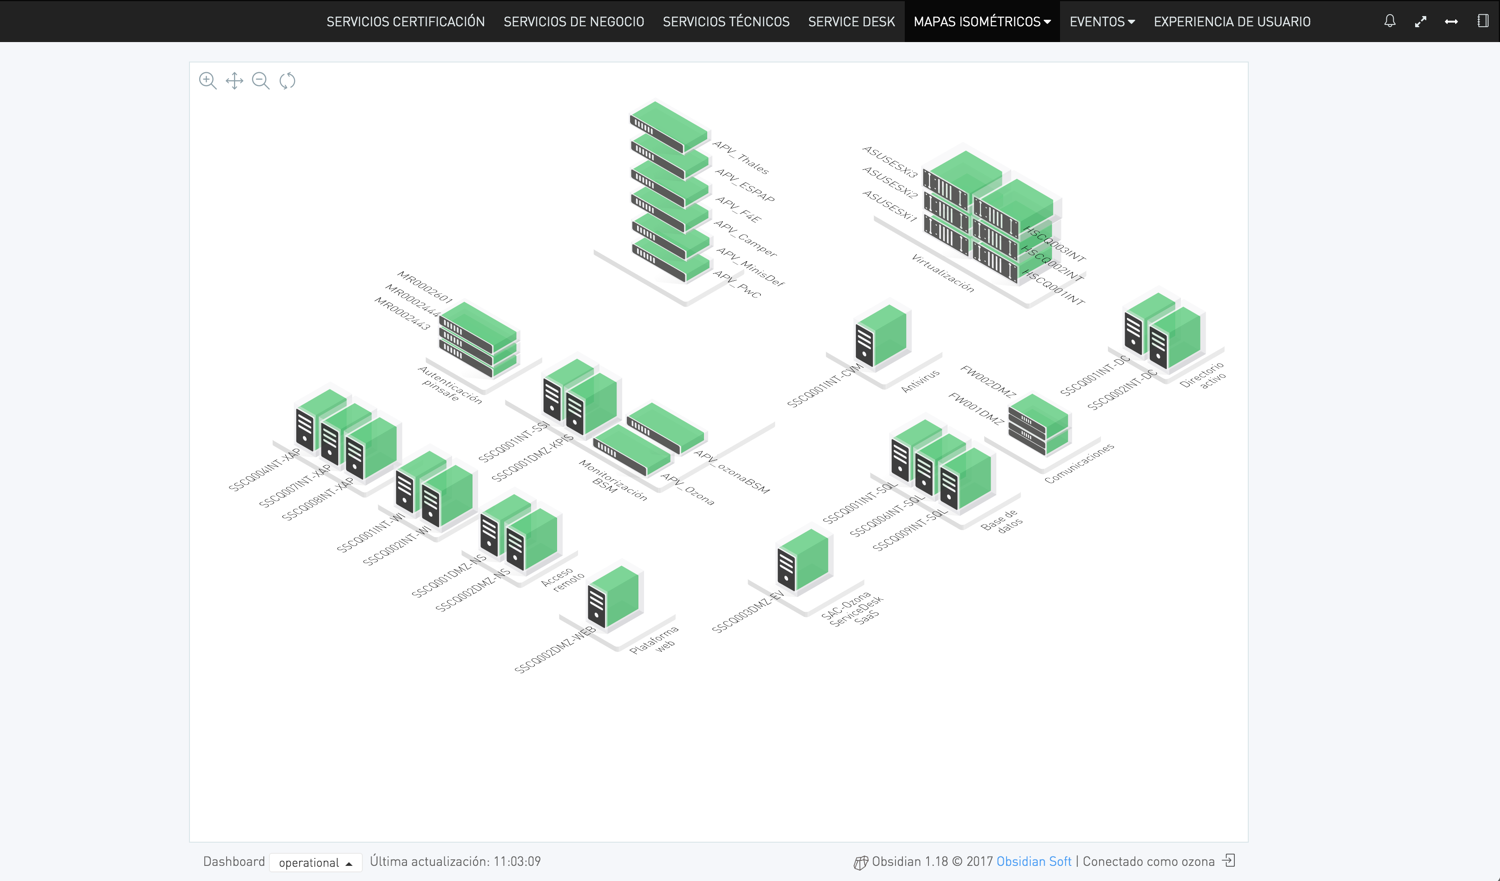
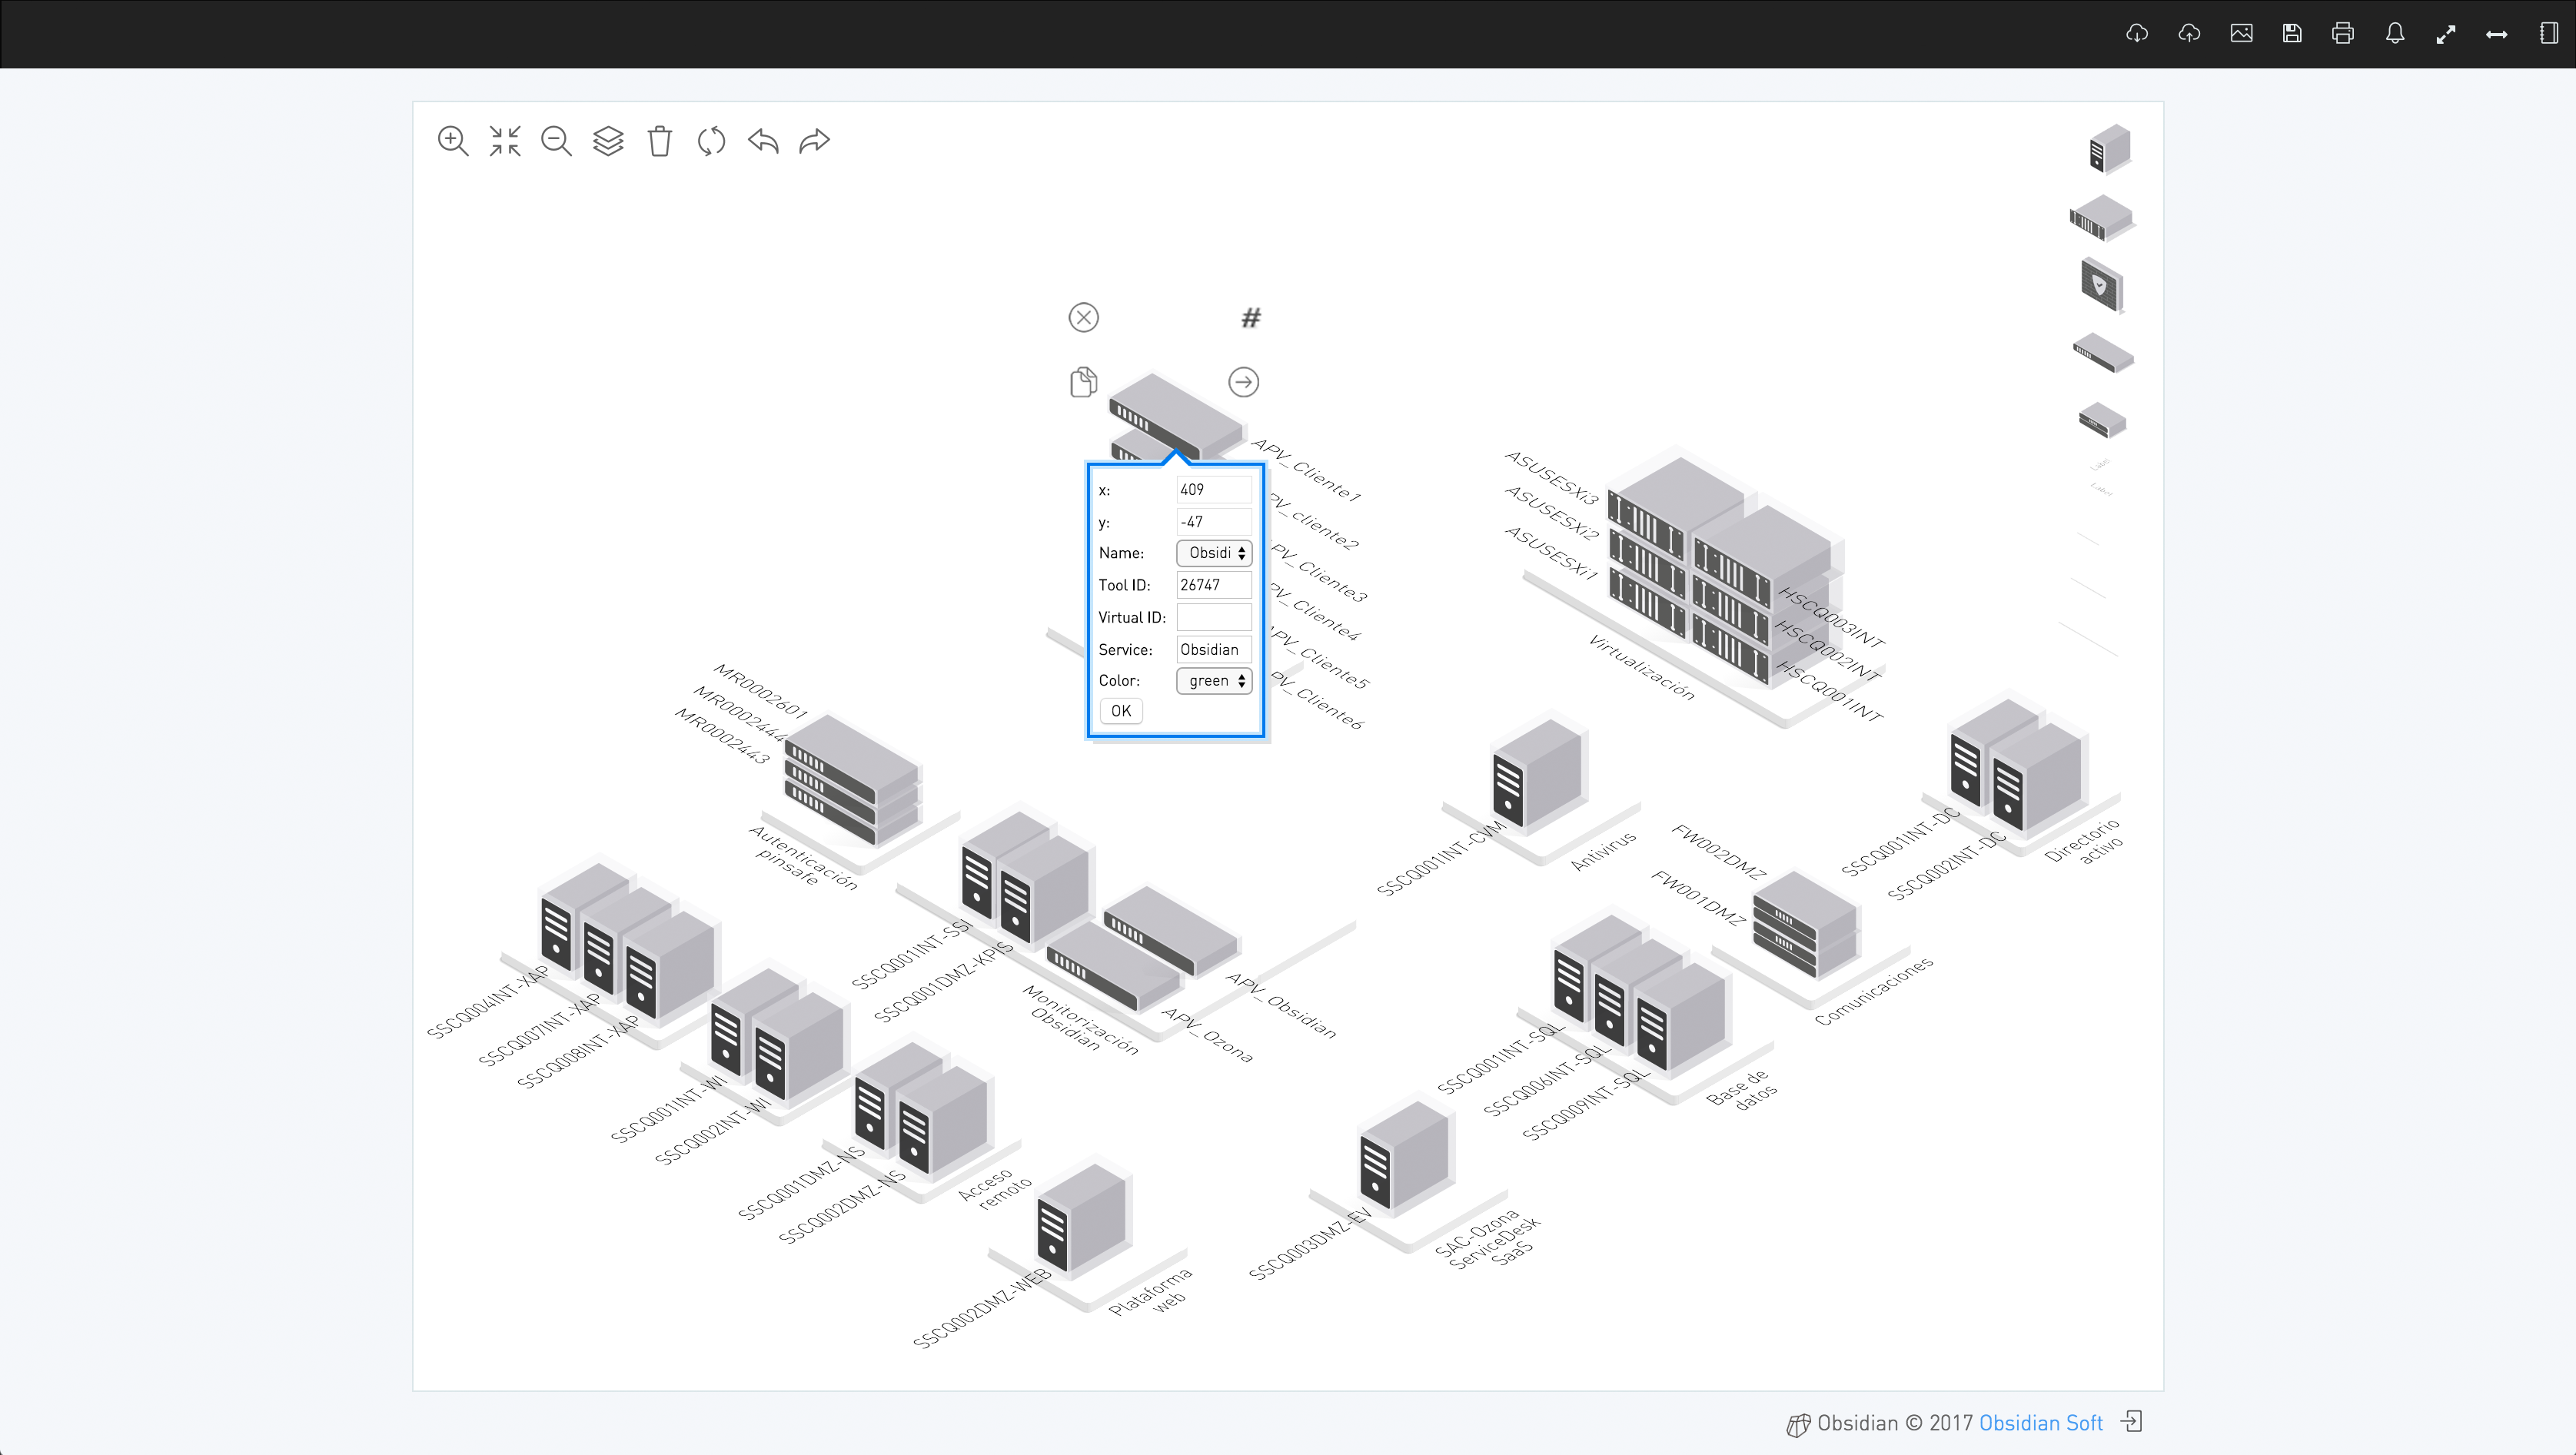
Infrastructure maps created using Obsidian’s online editor
Category
dashboard, dashboardEN, mapa, mapaENIn addition to an API for integration of any type of SVG diagrams, Obsidian also offers an online editor for isometric map creation. This example shows a real design of an infrastructure map created using Obsidian’s online generator which has complete service modelling integration and immediate publishing to dashboards. The images show an example of the map editing mode, along with a preview of how it will appear once integrated within the dashboard and mapped to the infrastructure components.