
The answers that matter
Obsidian is the AIOps platform that reads the telemetry corporate tools already generate (metrics, logs and traces) and turns it into the vital signs of each service: availability, capacity, support or SLA compliance. In real time, without replacing the current tools, and in a language both operations and the business understand.
Never has so much telemetry been available
Nor so few answers when it matters
When it is time to decide, the question is not how much data there is, but whether it can be read in time. Most organizations cannot answer, confidently and in real time, basic questions about their services:
- Is any service level being breached?
- If so, what is the root cause?
- What is the impact on the business?
- What actions can be taken to fix it?
- What is the expected duration of the outage?
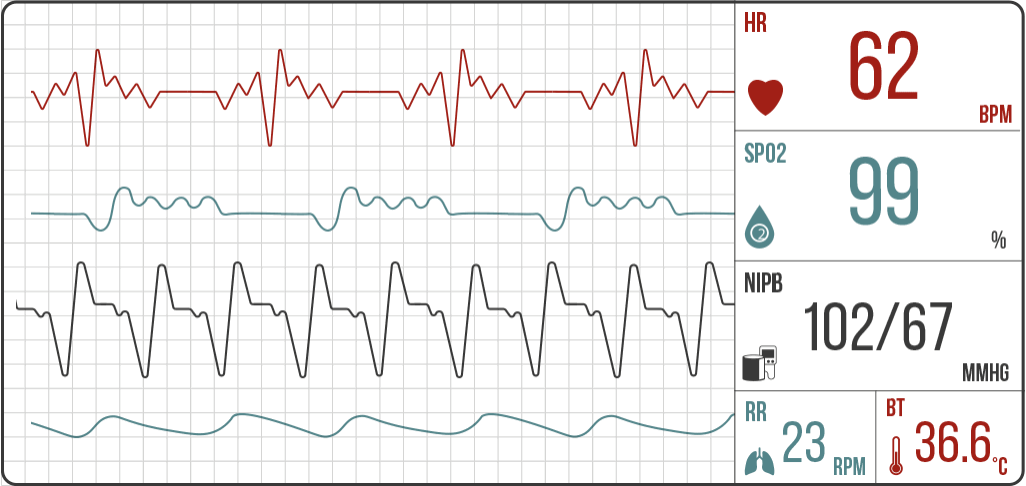
From technical monitoring to the vital signs of the service
Just as a few vital signs sum up a person's health, Obsidian computes the vital signs of IT services: availability, capacity, support, cost, risk, SLA compliance, and more. It turns technical data into indicators.
Put existing telemetry to work for real-time decisions
Obsidian does not replace your existing tools: it builds on them. It takes architecture data from CMDBs, inventories or GRC tools, and telemetry and observability data from every kind of monitoring tool, models it and turns it into indicators the business understands.
Visual modeling
A console to model services and processes from scratch or from a CMDB or inventory, with dependencies and impact in plain view.
Multi-source integration
Monitoring, observability, CMDBs, service desk, BPM tools. Data that already exists, without reinventing the stack.
AIOps calculation engine
It integrates data from corporate sources and computes, in real time, technical and functional indicators at multiple levels.
Synthetic indicators
End-to-end availability, capacity and demand, service desk quality, user experience.
Dashboards and reports
Real-time visualization, tracking reports and an API to integrate with BI tools.
Alerts and notification
The right alert, on the right channel, to the right team. And to the business when the impact warrants it.
Integrate. Model. Decide.
Obsidian connects with the tools you already have, models them as services and processes, and turns that into decisions. It does not replace the stack: it leverages it.
Integrate
Monitoring, observability, CMDBs, service desk and BPM. The telemetry that already exists, without duplicating anything.
Model
The AIOps engine correlates and computes indicators over a model of services and processes.
Decide
Health, compliance, root cause and impact · in dashboards, alerts, reports and API.
Works with
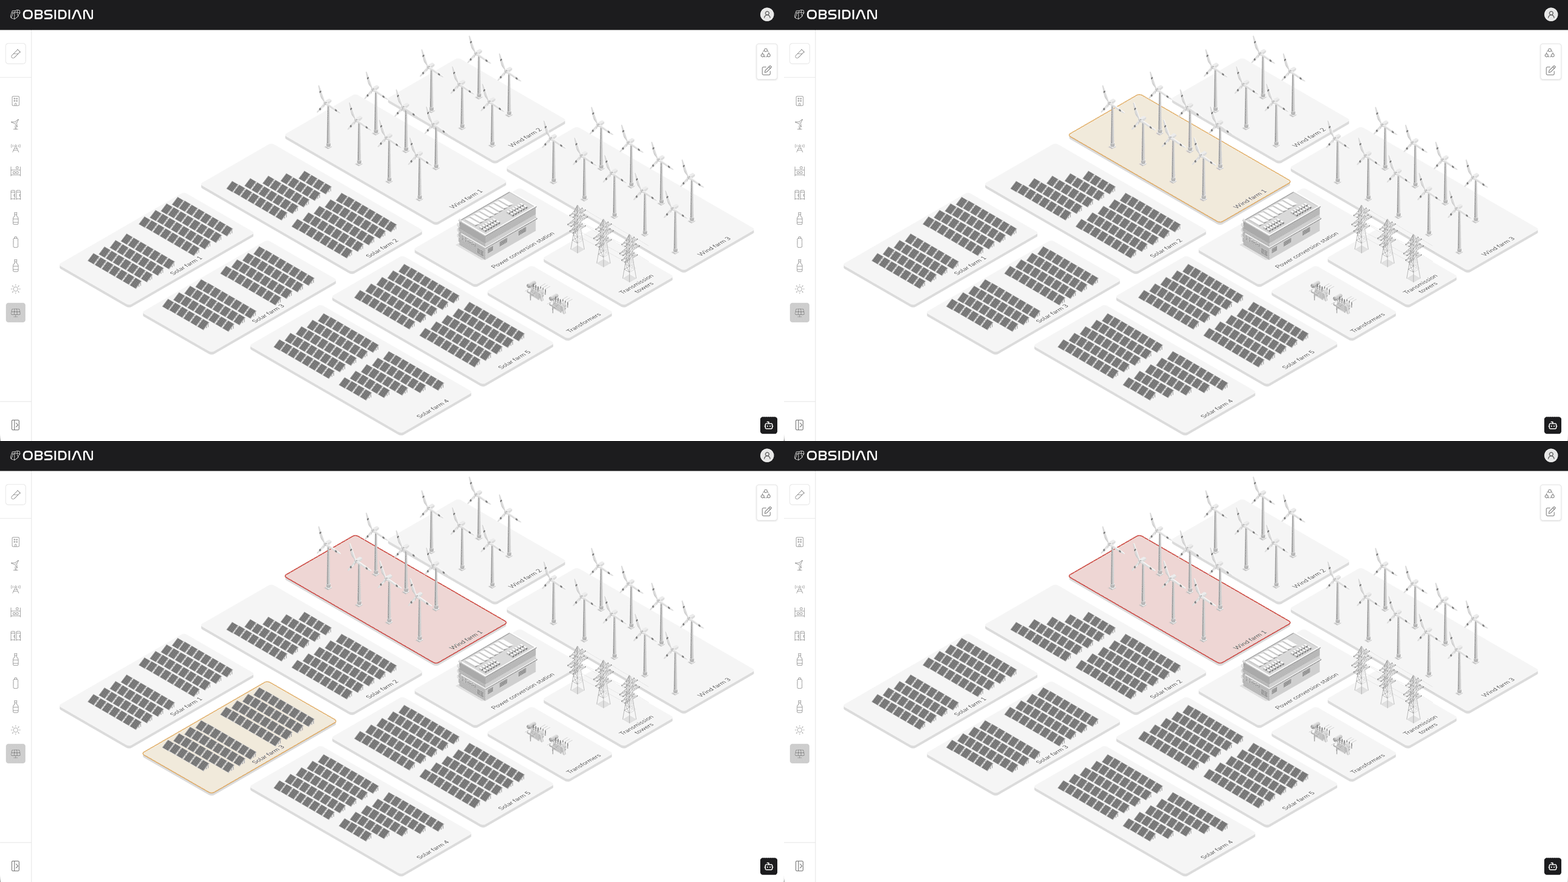
One platform. Any process
IT services, business processes or industrial plants: if it can be modeled, Obsidian reads its vital signs. These are real views of the platform.
Sensitive data, maximum assurance
Information is handled to the most demanding international standards for security, quality and IT service management, with data hosted in Europe.






What people ask most about Obsidian
What is AIOps and how is it different from monitoring?
AIOps applies statistics and AI to telemetry to detect anomalies, correlate events and estimate root cause and impact. Monitoring collects metrics; Obsidian interprets them and turns them into the health, compliance and impact of each service.
Does Obsidian replace my monitoring tools?
No. Obsidian does not replace monitoring or observability: it builds on them. It integrates the telemetry your tools already generate (Datadog, Zabbix, Prometheus, ServiceNow, etc.) and turns it into health, compliance, root cause and impact indicators.
Which tools does Obsidian integrate with?
Monitoring and observability (Zabbix, Prometheus, Nagios, Dynatrace, Datadog, Splunk, Grafana, Elastic), cloud (AWS, Azure, Google Cloud, VMware), ITSM/CMDB and service desk (ServiceNow, BMC Remedy, Jira Service Management), containers (Kubernetes, OpenShift) and data/BI (API, Power BI, Tableau).
How is Obsidian deployed?
In public cloud, on-premise or a hybrid model; on virtual machines or containers, with native orchestration on Kubernetes and OpenShift.
Which certifications does it hold and where is data hosted?
It is certified to ISO/IEC 27001, ISO/IEC 20000-1, ISO 9001 and ISO 14001, and ENS medium level, with data hosted in Europe.
Vital signs, on a real service
A session with real data to see how Obsidian turns telemetry into health, compliance, root cause and impact.