go to top
Obsidian Business Service Intelligence

Monthly value distribution report generated in Tableau

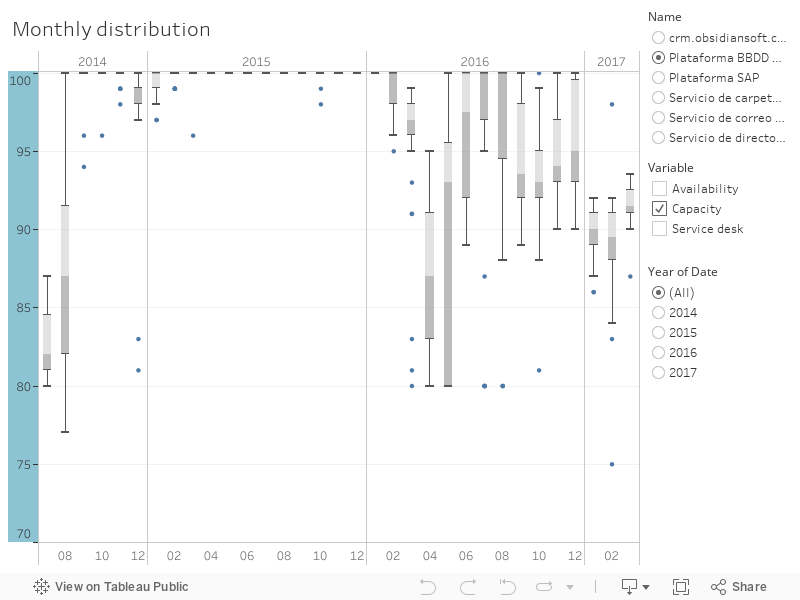
Example of Obsidian’s integration with Tableau for exporting monthly service provision reports.

Export monthly value distribution data for unavailability, capacity and quality of customer service care in the service desk to indicate:

  • outliers
  • minimum, maximum, median and quartiles

The chart allows you to select the service, analysis variable, adjust the timescale, etc.

X
Obsidian
Privacy Overview

This website uses cookies so that we can provide you with the best user experience possible. Cookie information is stored in your browser and performs functions such as recognising you when you return to our website and helping our team to understand which sections of the website you find most interesting and useful.

Please check our cookie policy for details.