

Service modelling is a key activity for ensuring the correct monitoring of the performance of an organization’s IT services. As for automatic modelling, it has become increasingly important in this era of new IT applications, often based on microservice architectures.
Obsidian complements the monitoring and service desk tools already available in an organization, providing a layer of governance over them. Using service modelling and the data provided by these tools, Obsidian builds a model of indicators to quantify ITSM processes (capacity, availability, service levels, etc.) in real time. As a result, it provides relevant information, both at a technical and at a business level.
The webinar Automatic modelling of microservice architectures with Obsidian offers an introduction to service modelling with Obsidian and its application to automatic modelling of a microservice architecture. Below is a brief summary of the contents of the presentation.
SERVICE MODELLING WITH OBSIDIAN
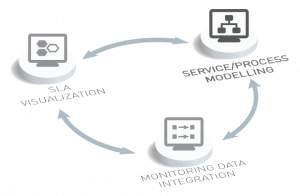
The three core activities of Obsidian’s operation.
Service modelling is the first of the three core activities of Obsidian’s operation. It is followed by the integration of metrics and indicators and the display of SLA compliance.
Based on the techniques used in CMDB design and configuration management, service modelling serves to indicate the dependencies between services. It is also used to define the functionalities of the service, also called subservices, and the platforms that support them (systems).
Once this basic structure has been established, the elements that make up these systems, services and subservices–such as servers, infrastructure or applications–can be added to the model.
Obsidian allows the organization to model its services in four ways:
- Manually
- Visually
- Through one or more CMDBs or similar tools
- Automatic modelling based on the application of a series of criteria and rules.
It is recommended to start with a manual modelling in order to obtain quick wins. However, the process should be gradually automated. In fact, automation can be critical in dynamic environments, such as microservice architectures.
INTEGRATION OF METRICS AND INDICATORS
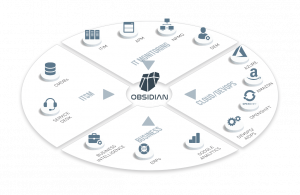
Examples of the sources Obsidian uses to obtain metrics and indicators.
After completing the modelling of services, Obsidian proceeds to the integration of metrics and indicators from all kinds of tools available in the organization. These metrics and indicators will then be used to quantify the performance of the modelled elements. The previously defined propagation and criticality criteria will be taken into account to assign performance values to services and their dependencies.
Metrics and indicators can be integrated at all levels of modelling (software, infrastructure, etc.). This is achieved by mapping relevant probes, metrics and indicators, be it manually or automatically. These will evaluate the performance of the element based on the analysis dimensions available. By default, the standard Obsidian model identifies the capacity, availability and service desk dimensions, and it automatically calculates the level of service from the values obtained from each.
When Obsidian’s calculation engine detects a non-compliance in any of the modelled probes, it propagates this value following the propagation and criticality criteria established for each tree level. This allows the organization to see if the service-level breach is caused by an element of such service or if, on the contrary, it is due to a dependency on another service.
SLA COMPLIANCE DISPLAY
Afterwards, the information obtained is displayed in the form of dashboards that allow the user to obtain a real-time view of service performance. In fact, Obsidian provides both historical information for monitoring performance and indicators in real time. All reports are always accompanied by automatic text interpretations available in 5 languages, generated with NLG technology.
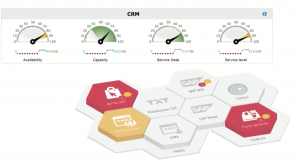
Examples of dashboards generated by Obsidian to display compliance levels.
Another key aspect of Obsidian is that it moves from quantitative metrics to qualitative or categorical indicators. That is, compared to other tools, Obsidian represents information in a way that can be understood visually, without the need for technical knowledge, and provides answers to different types of users.
MODELLING THAT IS SUITABLE FOR THE OLD IT AND THE NEW IT
Moreover, Obsidian’s characteristics make it suitable for both on-premises environments (old IT) and architectures associated with new IT, such as cloud environments, hybrids, microservice architectures, etc. It can be used for modelling on-premises services deployed in the organization’s data centers, more static, and cloud services and dynamic infrastructures, subject to frequent changes. It also allows for the modelling of both physical and virtual server-based services, as well as container-based services or pods deployed on platforms such as Kubernetes. Finally, Obsidian’s modelling is suitable for client-server applications, associated with old IT, and also for applications based on microservice architectures.
AUTOMATIC MODELLING OF MICROSERVICE ARCHITECTURES WITH OBSIDIAN
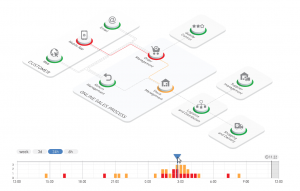
Automatic display of the microservices’ performance over time.
In addition to offering more details about these and other aspects of Obsidian and of service modelling in general, the webinar shows a specific case study about an organization that supports its online sales model in a microservice architecture.
This example explains how to approach the modelling of a microservice architecture with Obsidian, using the information obtained from the ServiceNow CMDB and the Prometheus monitoring tool to select metrics and indicators that provide relevant information on performance, both at the technical and functional levels. Then, it shows how to configure the automatic display of said information, taking into account the impact at different levels and at different points in time.
You may access the full content of the webinar below. The webinar was taught by Lidia Sánchez, from ObsidianSoft, as part of the IT Management Tools Course 2020, organized by itSMF Spain.
Further information
If you want more information about service modelling or any other features of the Obsidian intelligent monitoring platform, please contact us via the attached form.
NOTE Only professional e-mail addresses are accepted. Requests from gmail, yahoo, hotmail, etc. accounts will not be processed.
The personal data collected will be used to process your request. You may exercise your rights of access, rectification and cancellation by writing to Obsidian Soft, calle Méndez Álvaro, 20 · 18045 · Madrid.
You can also subscribe to our newsletter or to our YouTube channel, which currently has 1570 subscribers. You may also be interested in reading our blog, as well as the snews section of our website in order to find our more about Obsidian. Lastly, you can follow us on LinkedIn, Facebook and Twitter.